By observing the whisky auction prices, we can determine the most wanted whisky regions and distilleries. As a first attempt to source differences in prices we now want to compare the production capacities and put them in relation to the whiskystats index values.
“Today’s rain is tomorrow’s whisky”. As obvious as this famous scottish proverb seams, as true is it’s statement. Before they find their way to the dedicated auctions and thereby to our database, each and every whisky has to be distilled, stored and bottled. Hence, it is only natural to assume that the production capacity of the respective region or distillery has a significant influence on the prices we observe, especially since rarity plays a central role in every collectors’ environment.
In the following analysis we only consider still operating distilleries. Therefore, some index values (especially those of the whisky regions) will differ from the ones you find in our toolbox.
The Actively Producing Regions’ Indices
We start off with a comparison of the whisky producing regions which are most relevant to the secondary whisky market. These are the six scottish whisky regions we have already introduced in our previous article and of course recently added Japan. Since we now only want to consider operating distilleries, we have to recalculate our region’s indices.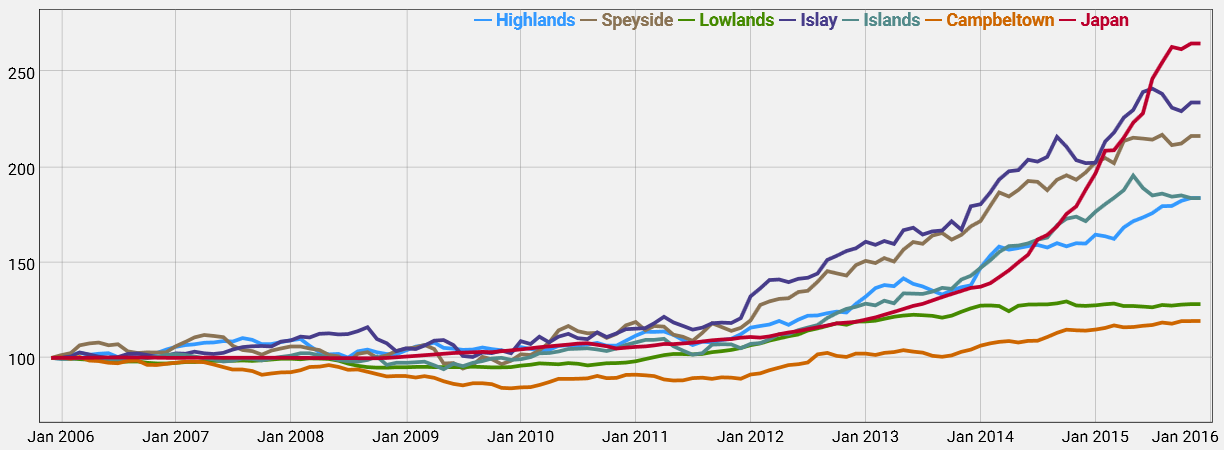
The results are quite interesting since we never filtered out the silent distilleries before. Compared to our initial ranking of the whisky regions, there are three major changes to point out. First, the most traded whiskies from the currently operating japanese distilleries are the most valuable ones. They even top the islay whiskies by more than 30 index points. Secondly, the Highlands index lost 50 points and is now on pari with the Islands index. Thirdly, with the exception of Campbeltown all indices are beneath the respective region’s index which includes the silent distilleries. So once more, the effect of silence showed off.
The Capacity of the Whisky Producing Regions
We once again use the above indices as a measure of the wanted level of each region’s whiskies. By comparing the latest index values with each region’s production capacity, we try to find out if the amount of produced spirit affects the prices on the secondary market. The stated production capacities describe the number of litres of pure alcohol each region’s distilleries are capable of producing each year. Note that this is not the actual production, only the respective possible maximum output. These numbers are sourced from the Malt Whisky Yearbook 2016.
We rank the regions by their latest index values and add the production capacity to the listing.
- Japan (265): 17.170.000 Litres of pure alcohol (Lpa)
- Islay (234): 19.950.000 Lpa
- Speyside (216): 226.150.000 Lpa
- Highlands (184): 93.145.000 Lpa
- Islands (184): 10.700.000 Lpa
- Lowlands (128): 17.845.000 Lpa
- Campbeltown (119): 2.300.000 Lpa
From what we see it is not possible to conclude that there is a structured relationship between a region’s production capacity and its index value. What we observe is that the two highest ranking regions (Japan and Islay) have a comparable amount of whisky produced each year. But then again the Lowlands have the same capacity, and those bottles only gained 28% in value over the last decade. So probably we have to narrow things down. That is why we now have a look at the single distilleries.
The Capacity of the Whisky Distilleries
All in all there are 85 distilleries for which we can calculate an index and know about the production capacity. Hence, a simple listing of these distilleries and their corresponding stats would do us no favour in terms of interpretability. So what we want to do instead is plotting the litres of produced alcohol against the latest distilleries indices of November 2015.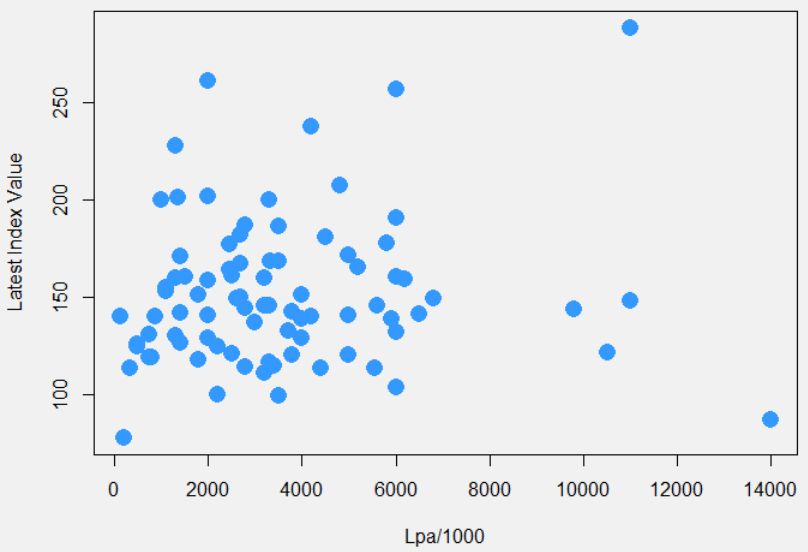
The question we try to answer is if the production capacity of the distillery influences the prices of its whiskies on the secondary market. Therefore, we need to check if the above point cloud includes a structured dependency between Lpa and index values. Our approach is to fit a linear model. This means, we simply draw the line with minimal distance to the above points. This line is coloured orange in below graphic.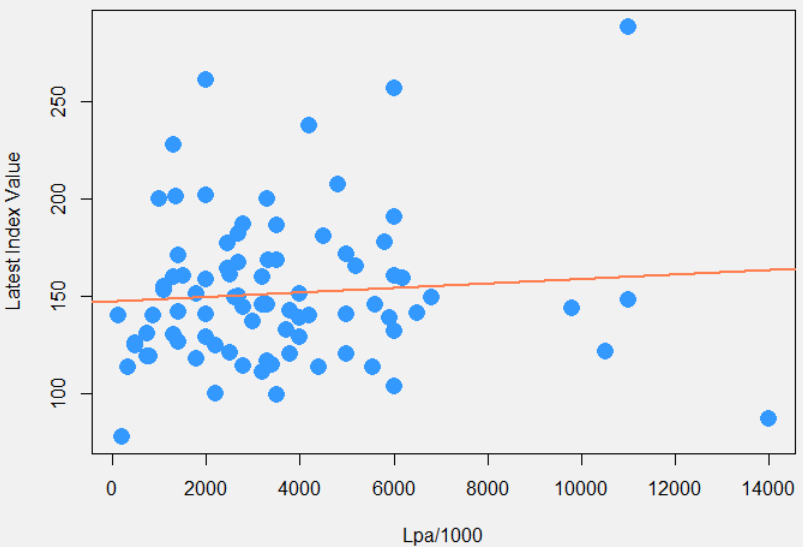
The first observation is that the slope of this line is only just positive. This visual impression is backed by the statistical analysis of this simple linear modell. The corresponding coefficient’s estimate does not significantly differ from zero. In other words this means, that based on this analysis we cannot conclude that the production capacity of a distillery significantly influences the observed prices of the corresponding whiskies on the secondary market.
So what does this mean? Our assumption was that a small production capacity would lead to higher prices. We used our indices as a measure for price levels and the annual production capacity as a measure for rarity. Our analysis showed that we could not find any proof for our assumption. This, of course, does not mean that rarity does not influence the prices at all! Maybe our measure for rarity wasn’t the best. Maybe the (collectable) whiskies we observe on the secondary market have little less to do with the officially published production numbers since this numbers are dominated by figures relating to the primary market. Or maybe the production capacity is a relevant factor but its effect’s magnitue is too small compared to others.